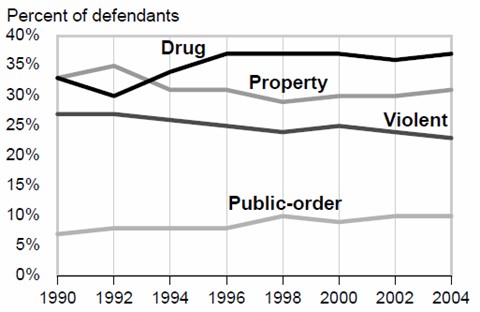
With the Obama administration in the midst of trying to dinosaur the phrase “War on Drugs,” we thought it would be worth looking at some of that 40-year-old conflict’s greatest defeats. And we found a true gem buried within this recent Department of Justice bulletin (PDF), a compilation of felony-case statistics from 2004.
There are some great nuggets throughout the document, such as the revelation that auto-theft cases are the easiest for prosecutors to win, and the fact that 97 percent of convictions stem from a guilty plea, rather than a trial verdict. But what left us gobsmacked was the sheer number of drug cases clogging up state courts. The bulletin explains the graph above:
Since 1990, defendants charged with a drug or property offense have comprised about two-thirds of felony cases in the 75 largest counties. From 1990 to 2004 the percentage of felony defendants charged with a violent offense has ranged from 23% to 27% (figure 5). Since 1994, drug
defendants have comprised the largest group, ranging from 35% to 37%. Property defendants have accounted for 29% to 31% of defendants during this time.
(Our bolding.) Additionally, it’s not clear what percentage of the violent felonies are related to the business of drugs. So that 37 percent figure may only be a baseline in terms of gauging the War on Drugs’ impact on our criminal justice system.
We’d love to know the economic affect of squeezing so many drug cases through the courts—not just in terms of the costs of prosecution and incarceration, but also the losses associated with removing people from the workforce and destabilizing their families. Please drop us a note if you’re aware of any researchers who’ve tackled that issue.


Like gas stations in rural Texas after 10 pm, comments are closed.